This item is taken from IGCSE Mathematics (0580) Paper 43 of October/November 2013.
To deal with this item, let us summarize the details of the problem:
(a) Syllabus area: Algebra
(b) Specific topic: Speed-Time Graphs
(c) Formulas/Concepts Needed: gradient, area of a trapezium, average speed
For (i), let us determine which part of the graph is needed. Since the question is about deceleration, which means decreasing speed, it means that the graph should be downward. That could be seen on the last part of the graph as shown here (in red).
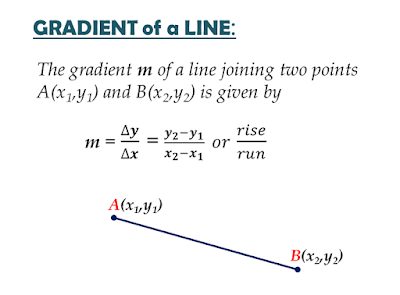
To find the deceleration, let us recall that the deceleration is the change of speed over time. We can achieve this by getting the gradient of the line. We will use two different methods here.
First, let us use the common notion for gradient - that it is rise/run. In the graph, the rise is the vertical distance and the run is the horizontal distance.
We can see that the rise is equal to 16 and the run is from 20 to 25. That is
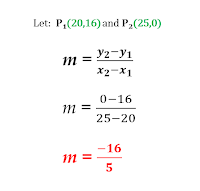
Second, let us use the formula for gradient - that is change in y over the change in x. To start with, let us determine the coordinates of the endpoints of the line.
Now we can use the formula to find the gradient.
For both methods, notice that the answer is negative. This suggests that it is decreasing at that constant speed. The negative sign may be disregarded in the final answer.
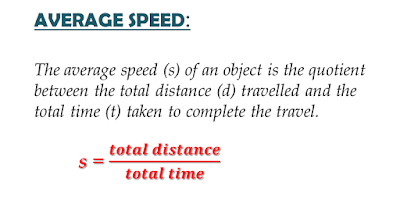
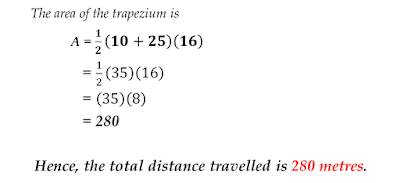
To answer (ii), let us recall that average speed requires total distance and total time. To find the total distance covered by the car, let us find the area of the figure under the graph. In this graph, it is a trapezium. To find the area of the trapezium, let us identify the parts needed.
Using the formula for the area of a trapezium, we can now find the area under the graph.
Further, we can now determine the average speed by getting the quotient of the total distance and the total time taken.
ANSWERS:
(i) 16/5 m/s2
(ii) 56/5 or 11.2 m/s
-------------------------------------------------------------------------------------------------------------------------------
Your comments and suggestions are welcome here. Write them in the comment box below.
Thank you and God bless!
Thank you and God bless!


No comments:
Post a Comment