To deal with this item, let us summarize the details of the problem:
(a) Syllabus area: Statistics
(b) Specific topic: Mean of Grouped Data
(c) Formula Needed:
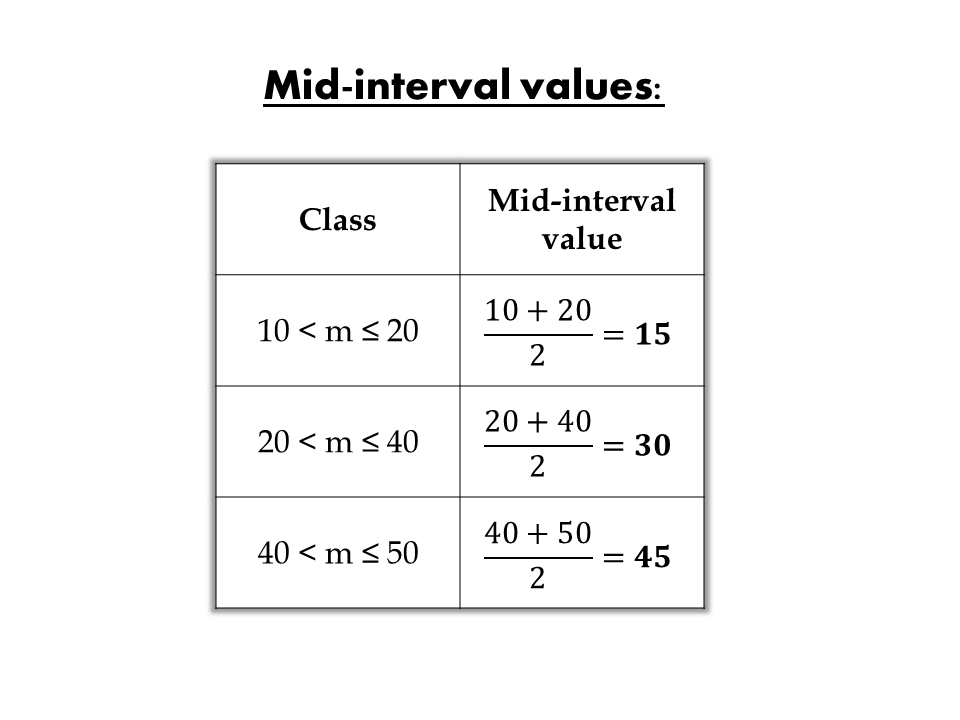
Before we could get the mean, let us determine first the mid-interval values of each class.
Here is the summary of the classes with their corresponding mid-interval values and frequencies.
You can now find the mean using the formula above.
Another way of presenting the solution is through the use of a table for finding the mean.
From the table, we can directly calculate the value of the mean.
Therefore, the mean of the 60 potatoes is 32.5.
---------------------------------------------------------------------------------------------------------------
Your comments and suggestions are welcome here. Write them in the comment box below.
Thank you and God bless!


No comments:
Post a Comment